Intrusion Detection System
What changes when an intrusion detector has to learn from a changing stream?
The engineering question#
An intrusion detector can perform well on familiar traffic and still struggle when the traffic mix changes. This project explores what happens at that transition: can an adaptive model improve detection of a newly introduced attack family while retaining what it learned earlier?
The experiment compares a Hoeffding Tree baseline with an Adaptive Random Forest in River. It follows their predictions through two phases, then examines accuracy, false positives and retention of the earlier distribution. The useful result is a trade-off: the adaptive model performs better on the second phase, but its forgetting measure is higher.
Separating adaptation from forgetting#
Two different failures can look like a drop in accuracy. A model may fail to recognize new patterns, or learning those patterns may reduce its performance on old ones. Measuring only the current stream hides the distinction. A separate check against the first phase is needed to ask whether old knowledge survived.
The label “static” in the comparison describes the baseline used in this experiment. A Hoeffding Tree is itself a streaming learner; the name should not be read as a claim that this algorithm can never learn incrementally. The important comparison is the configured baseline against an ensemble with mechanisms for replacing trees.
How the two-phase experiment is organized#
| Stage | Traffic | Question |
|---|---|---|
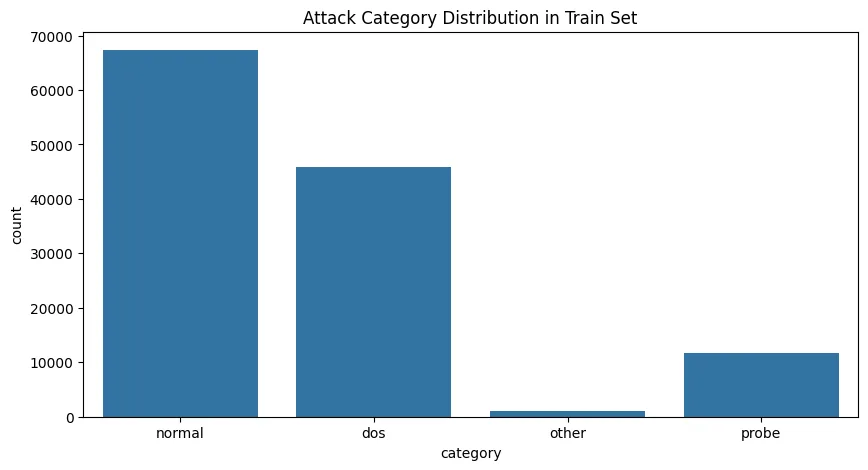
| Phase 1 | Normal and DoS traffic; 113,252 samples | What does each model learn before the distribution changes? |
| Phase 2 | Normal and Probe traffic; 10,817 samples | How does it behave when the introduced attack family changes? |
| Retention check | Revisit Phase 1 performance | How much of the earlier performance remains? |
Data Distribution#
Why the order of prediction and learning matters#
The project uses prequential evaluation: predict for an observation, score that prediction, and then use the observation to update the learner. Reversing that order would let the learner see an answer before being evaluated on it. This makes the sequence of operations part of the experiment, not just an implementation detail.
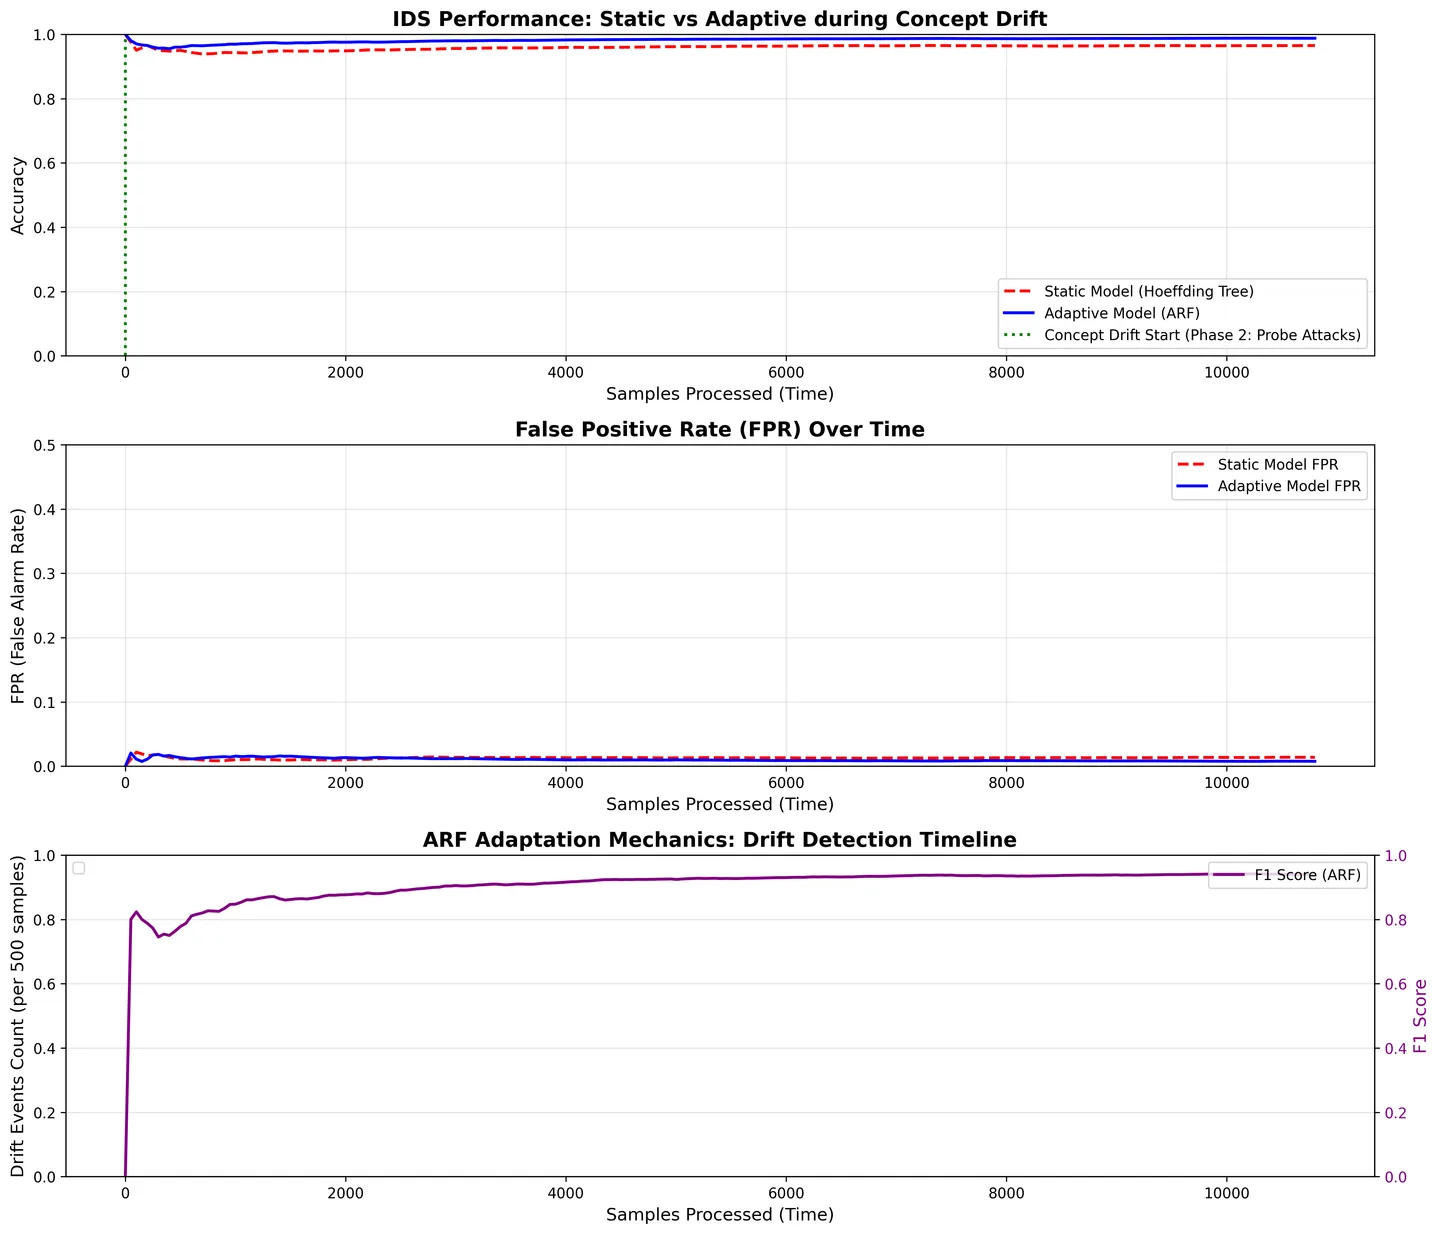
Cumulative metrics summarize a run, while the time-series plots reveal its shape. A model that recovers slowly after the phase change and one that stays consistently accurate can end with similar averages. Reading the transition alongside the final table makes that difference visible.
Results: accuracy is only part of the comparison#
| Metric | Baseline Hoeffding Tree | Adaptive Random Forest |
|---|---|---|
| Accuracy | 96.51% | 98.78% |
| F1 Score | 0.82 | 0.94 |
| False Positive Rate | 1.38% | 0.75% |
| Accuracy Drop | 3.29% | 1.02% |
| Forgetting measure | 0.002 | 0.014 |
| Tree Replacements | N/A | 728 |
Reading the result without hiding the trade-off#
In the reported second phase, accuracy rises from 96.51% to 98.78% and F1 from 0.82 to 0.94. The false-positive rate falls from 1.38% to 0.75%. That last comparison matters because a detector that frequently flags normal traffic can create substantial review work even when its headline accuracy looks strong.
The retention result complicates the story. The repository reports a forgetting measure of 0.002 for the baseline and 0.014 for the adaptive model, calculated as earlier-distribution accuracy before minus after the second phase. Better performance on the new stream therefore did not mean better retention on every measure. Choosing a model requires deciding which errors and which traffic distributions matter most.
Performance Results#
What 728 tree replacements can tell us#
The wrapper records when a tree object in the ensemble changes, associating each replacement with a sample position and tree index. This gives an observable trace of model turnover instead of treating the ensemble as a single opaque prediction function.
The recorded run contains 728 replacements. That is a count of observed replacements, not 728 distinct attacks or proof that every replacement improved a prediction. Correlating these events with the accuracy and false-positive curves is more informative than reporting the count alone.
Instrumenting tree replacement#
from river import tree, forest, drift

class MonitoredARF:
    """Wrapper around ARF that tracks drift detections and tree replacements."""
    def __init__(self, arf_model):
        self.model = arf_model
        self.drift_log = []
        self.tree_replacement_log = []
        self.sample_count = 0

    def learn_one(self, x, y):
        old_tree_ids = [id(t) for t in self.model.data]
        self.model.learn_one(x, y)
        self.sample_count += 1
        new_tree_ids = [id(t) for t in self.model.data]
        for idx, (old, new) in enumerate(zip(old_tree_ids, new_tree_ids)):
            if old != new:
                self.tree_replacement_log.append({
                    'sample': self.sample_count, 'tree_id': idx
                })
        return self

def get_adaptive_model():
    arf = forest.ARFClassifier(
        n_models=10,
        max_features=0.6,
        drift_detector=drift.ADWIN(),
        warning_detector=drift.ADWIN(),
        seed=42
    )
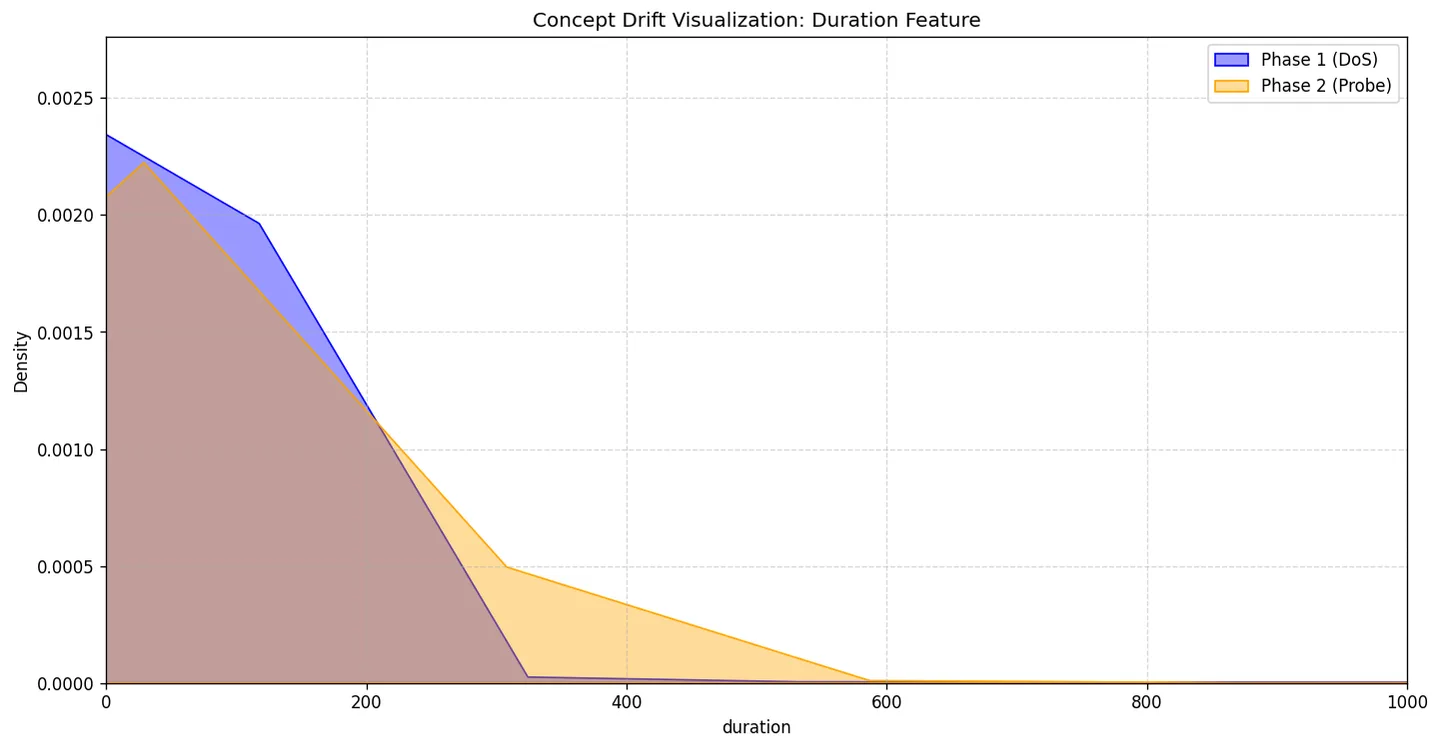
return MonitoredARF(arf)Concept Drift Visualization#
Where this experiment stops#
The reported setup uses KDD Cup 99 data and a deliberately staged shift between attack families. It is a controlled comparison, not evidence of performance on current production traffic. Sample order, class balance and the chosen split all affect the result.
The next evaluation should repeat the run with several seeds, include a no-shift control, and test a newer dataset. It should also report prediction cost and memory use: a more accurate streaming model is only useful operationally if it can keep up with the incoming data. These are follow-up experiments, not additional results claimed here.
Tech Stack#
| Technology | Role |
|---|---|
| Python 3.11 | Core language |
| River | Online/streaming ML framework (ARF, Hoeffding Tree, ADWIN) |
| Scikit-learn | ML utilities & preprocessing |
| Pandas / NumPy | Data loading & manipulation |
| Matplotlib / Seaborn | Visualization & performance plots |
The lesson to carry into another ML project#
An adaptive model needs an evaluation that can reveal both improvement and damage. Track performance on the changing stream, revisit earlier distributions, and record the model changes that occur between them. That makes “the model adapted” an inspectable claim rather than a conclusion drawn from one final score.
Source and related reading#
- Experiment repository and reported results
Phase configuration, metrics, model configuration and experiment entry point.
- Lipid Ladder AI: what a synthetic evaluation can establish
Another case study about the boundary between a model score and evidence of usefulness.