URL Shortener
Keeping redirects responsive while analytics moves through a separate pipeline
One click, two workloads#
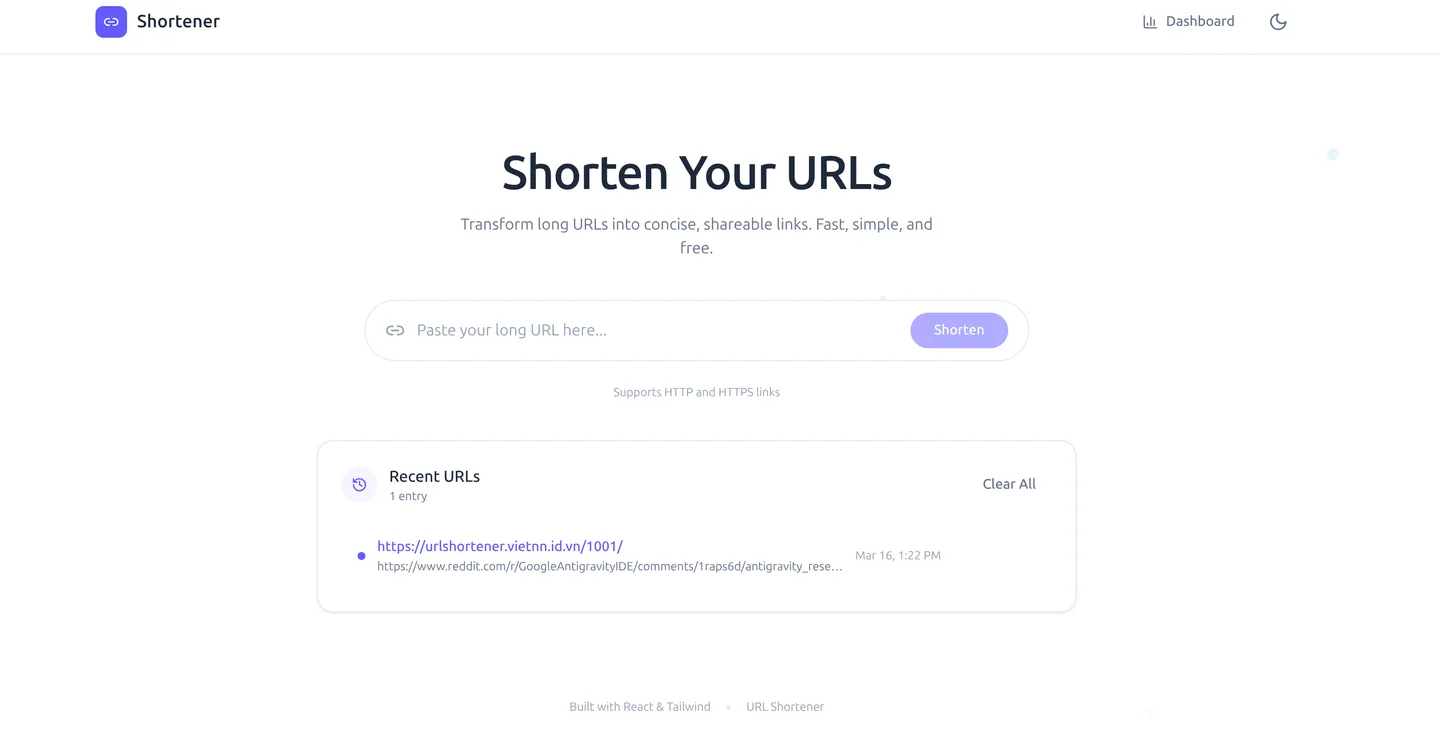
A short-link request has an immediate job: look up a destination and send the browser there. Recording that click is a separate job with different storage and query needs. This project uses that distinction to explore caching, asynchronous processing and the cost of operating a distributed application.
The implementation combines Django, PostgreSQL and Redis for URL creation and lookup, with Kafka and ClickHouse for analytics. The recorded k6 runs reach 292 requests per second at 500 virtual users and 330 at 1,000. Those figures are useful because the accompanying latency measurements expose where adding concurrency stops paying off.
What belongs in the redirect path?#
Writing each click to an analytical store before returning a redirect couples user-visible latency to analytics ingestion. Moving that work into a pipeline reduces that coupling, but it introduces a different question: when can the application honestly say a click has been recorded?
The architecture therefore has two goals to evaluate separately: fast URL resolution and reliable event processing. A successful redirect is not proof that an analytics row has already been stored. Treating these as separate outcomes makes both the monitoring and the failure cases clearer.
Architecture#
Client → Cloudflare (DDoS/WAF) → Gateway Nginx → Frontend Nginx
                                                          │
                                               Django Backend (4 Gunicorn workers)
                                              /        |         \          \
                                        Redis      PostgreSQL    Kafka    ClickHouse
                                       (Cache+      (OLTP)       │        (OLAP)
                                       Counter+                  │
                                       Metrics)                  ▼
                                                          Kafka Consumer
                                                        (Batch → ClickHouse)

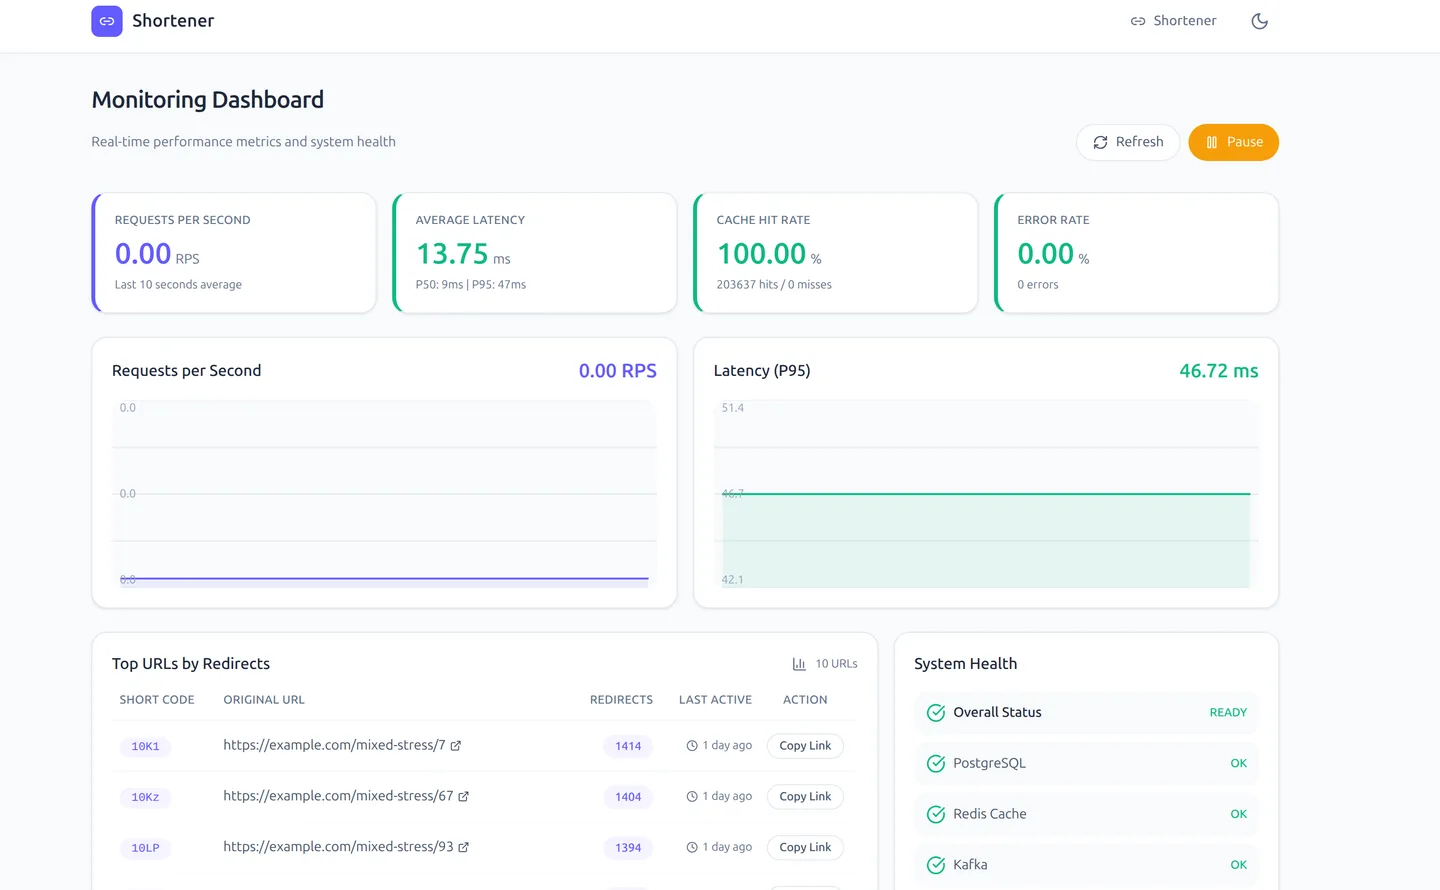
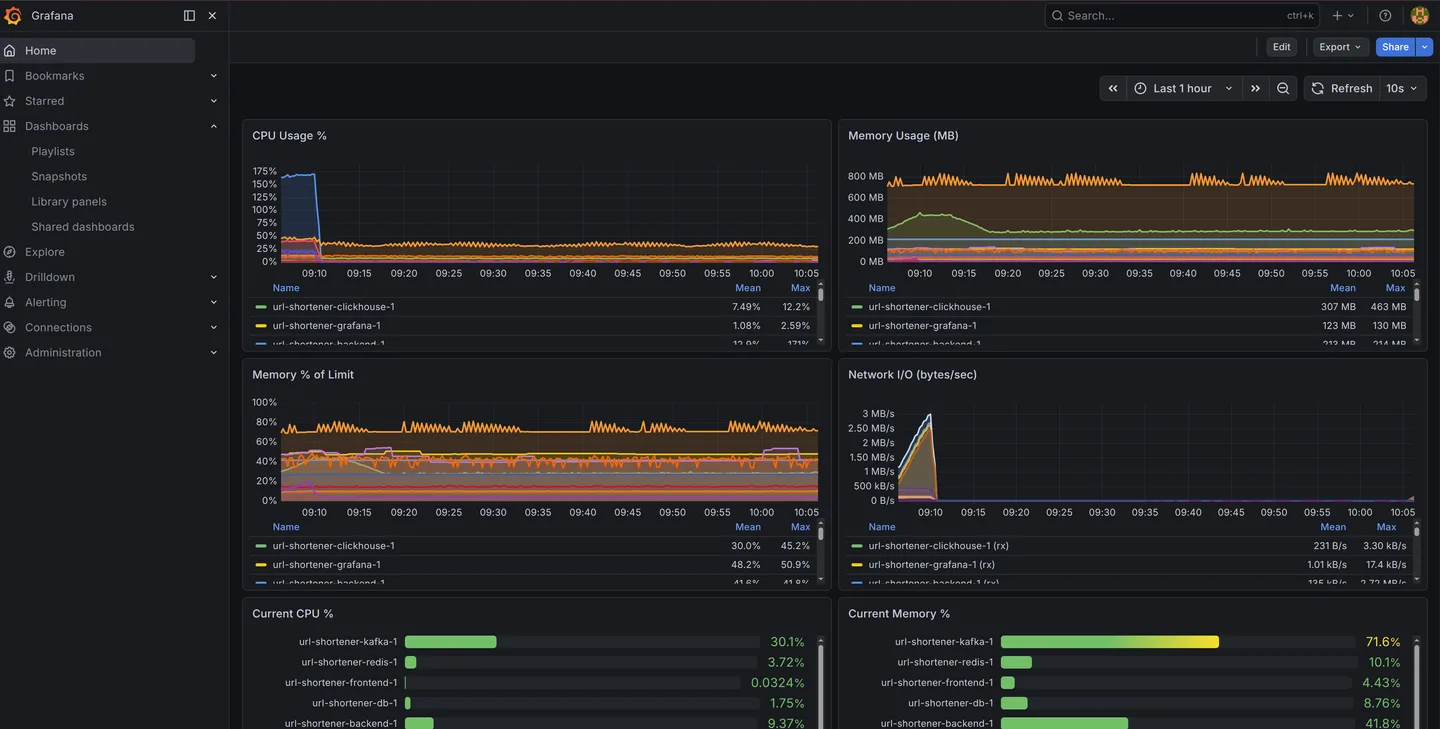
Monitoring: cAdvisor → Prometheus → Grafana | Metrics Sidecar → DashboardFollowing a redirect through the services#
- Django looks for the short code in Redis. A cache hit avoids the PostgreSQL lookup.
- On a cache miss, PostgreSQL supplies the URL mapping and the application fills the cache with a 24-hour expiry.
- The producer is called to enqueue a click event before the redirect response is returned. The behavior of that call depends on its buffering, acknowledgement and timeout configuration.
- A separate consumer collects events into batches and writes them to ClickHouse. Analytics queries can then run against that store without using PostgreSQL for the same workload.
Architecture Evolution#
| Version | Architecture | Limitation Solved |
|---|---|---|
| V1 | Redis storage and synchronous click tracking | Explore the redirect path; durability depends on persistence configuration. |
| V2 | PostgreSQL URL storage with Kafka-based analytics | Move analytics work away from the immediate redirect, while queries still share database resources. |
| V3 | ClickHouse analytics with buffered ingestion | Separate analytical queries from URL lookups, at the cost of more services and eventual consistency. |
Why use a counter for short codes?#
An incrementing Redis counter supplies an integer that is encoded as Base62. The attraction is operational simplicity: requests using the same counter receive distinct increments rather than generating random candidates and retrying collisions.
That property depends on preserving the counter and coordinating its use. Resetting it while old mappings still exist can reuse identifiers. Sequential identifiers are also predictable, so a short code must not be treated as an access-control secret. The useful claim is uniqueness within the maintained allocation scheme, not an unconditional guarantee under every recovery scenario.
Code: 2-Phase Redirect#
def redirect_url_view(request, short_code):
    cache_key = f"url:{short_code}"

    # Phase 1 (SYNCHRONOUS) — check Redis cache first
    original_url = cache.get(cache_key)
    if original_url:
        MetricsMiddleware.record_cache_hit()
        # Phase 2 (ASYNC) — fire-and-forget Kafka event
        redirect_producer.produce_redirect_event(
            short_code=short_code,
            timestamp=timezone.now().isoformat(),
            user_agent=request.META.get('HTTP_USER_AGENT', ''),
            ip=request.META.get('REMOTE_ADDR', '')
        )
        return redirect(original_url)

    # Cache miss → PostgreSQL with exponential backoff retry
    for attempt in range(3):
        try:
            url_obj = URL.objects.get(short_code=short_code)
            MetricsMiddleware.record_cache_miss()
            cache.set(cache_key, url_obj.original_url, timeout=86400)
            redirect_producer.produce_redirect_event(...)
            return redirect(url_obj.original_url)
        except OperationalError:
            delay = 0.05 * (2 ** attempt) + random.uniform(0, 0.01)
time.sleep(delay)The delivery boundary between Kafka and ClickHouse#
The consumer excerpt commits offsets after a successful batch insert. If insertion fails, keeping the offsets uncommitted leaves an opportunity to retry. But if insertion succeeds and the process fails before committing, the same records may be processed again. This is the gap where duplicate handling matters.
Exactly-once behavior across an external database requires more than manual commits. This portfolio does not present a verified deduplication protocol or failure-injection results. The architecture supports a discussion of retries and replay; it does not establish loss-free delivery under all failures.
Code: Kafka → ClickHouse Pipeline#
# Consumer: auto_commit=False, max_poll_records=500
event_buffer = []
flush_interval = 2.0  # seconds
max_buffer_size = 500

for message in consumer:
    event = message.value
    if event.get('short_code'):
        event_buffer.append({
            'short_code': event['short_code'],
            'timestamp': event.get('timestamp'),
            'user_agent': event.get('user_agent', ''),
            'ip': event.get('ip', ''),
        })

    # Flush on time window OR buffer full
    if time.time() - last_flush > flush_interval or len(event_buffer) >= max_buffer_size:
        if flush_to_clickhouse(event_buffer):  # retry with exponential backoff
            consumer.commit()   # manual offset commit ONLY after successful write
event_buffer.clear()A timer condition is not a timer#
The excerpt checks the flush interval inside the message loop. That distinction matters when traffic becomes quiet: a partially filled buffer does not get another time check until control returns to the condition. A complete consumer needs an idle-time flush mechanism or an equivalent polling design, plus a shutdown policy.
Batching trades fewer database writes for a delay before events become queryable. Buffer length, time since the last successful flush and consumer lag are useful follow-up measurements because they describe that delay directly. Request success rate alone cannot show an analytics pipeline falling behind.
Documented container limits#
| Service | CPU Limit | Memory Limit |
|---|---|---|
| Backend (Gunicorn) | 1.0 | 512 MB |
| PostgreSQL | 1.0 | 512 MB |
| Kafka | 1.0 | 1 GB |
| ClickHouse | 1.0 | 1 GB |
| Redis | 0.5 | 256 MB |
| Kafka Consumer | 0.5 | 256 MB |
| Frontend (Nginx) | 0.5 | 128 MB |
| Metrics Sidecar | 0.25 | 64 MB |
Performance Results#
| Metric | 500 VUs | 1,000 VUs |
|---|---|---|
| Total Requests | 90,447 | 101,516 |
| Throughput | 292 req/s | 330 req/s |
| Error Rate | 0% | 0% |
| Median Latency | 575 ms | 1,330 ms |
| p95 Latency | 1,610 ms | 2,850 ms |
What the load tests actually show#
Doubling virtual users increases throughput by about 13%, while median latency rises from 575 to 1,330 milliseconds and p95 from 1,610 to 2,850 milliseconds. The system completes more work, but each user waits longer. The recorded zero error rate is encouraging for those runs; it does not make the longer wait disappear.
This pattern suggests saturation and queueing somewhere along the tested path. Pinpointing the limiting service requires time-aligned request and infrastructure measurements. An earlier CPU note in this case study referred to a two-core backend limit, while the configuration table lists one core, so that note cannot establish the bottleneck for this configuration.
What a reproducible rerun should include#
The earlier 1–2 millisecond cache-path estimate is not comparable to the end-to-end k6 latency distribution. A rerun should record the exact request mix, cache warm-up, test duration, load-generator location, service configuration and commit. It should distinguish redirect latency from the delay until a click appears in analytics.
The resource table describes configured limits for the listed services, not measured consumption or a complete bill for every monitoring container. A cached redirect benchmark also does not establish the capacity of URL creation, cache-miss lookups or expensive analytics queries.
Code: Atomic Metrics Middleware#
# Lua script: atomically increment a key and set TTL only on first creation
_INCR_WITH_TTL_LUA = """
local val = redis.call('INCR', KEYS[1])
if val == 1 then
    redis.call('EXPIRE', KEYS[1], ARGV[1])
end
return val
"""

class MetricsMiddleware:
    def __call__(self, request):
        start = time.perf_counter()
        response = self.get_response(request)
        latency_ms = (time.perf_counter() - start) * 1000

        with self._redis.pipeline() as pipe:
            # RPS counter for this exact second
            self._atomic_incr(pipe, f"metrics:rps:{second_key}", TTL_RPS)
            # Latency sorted set (score=timestamp, member=latency_ms)
            pipe.zadd(latency_key, {f"{latency_ms:.3f}": timestamp_ms})
            pipe.zremrangebyrank(latency_key, 0, -(MAX_SAMPLES + 1))
            # Error counters (only 5xx)
            if status_code >= 500:
                self._atomic_incr(pipe, f"metrics:errors:5xx", TTL_CUMULATIVE)
            pipe.execute()
return responseInstrumentation has its own data model#
The metrics excerpt uses a formatted latency value as a Redis sorted-set member. Equal formatted values share a member, so repeated measurements can overwrite one another rather than count as separate observations. That can affect a percentile calculation built from the set. A production revision should give each observation a unique identity or use a suitable histogram.
This is a useful reminder when comparing a custom dashboard with a load generator: first check whether they measure the same requests, time window and aggregation. A mismatch is a reason to inspect the measurement path before tuning the application.
Gallery#
Tech Stack#
| Technology | Role |
|---|---|
| Django / DRF | REST API & URL routing (4 Gunicorn workers) |
| PostgreSQL 15 | OLTP — URL mappings only, never updated after creation |
| Redis | L1 cache (24h TTL), atomic counter (INCR), real-time metrics via Lua scripts |
| Apache Kafka | Event streaming — fire-and-forget from redirect, manual offset commits |
| ClickHouse | OLAP analytics — MergeTree engine, monthly partitions, 1-year TTL |
| React 18 / Vite | Dashboard with real-time metrics, 5s polling, 60-point history |
| Prometheus + Grafana | Infrastructure monitoring — cAdvisor scrapes at 5s, pre-provisioned dashboards |
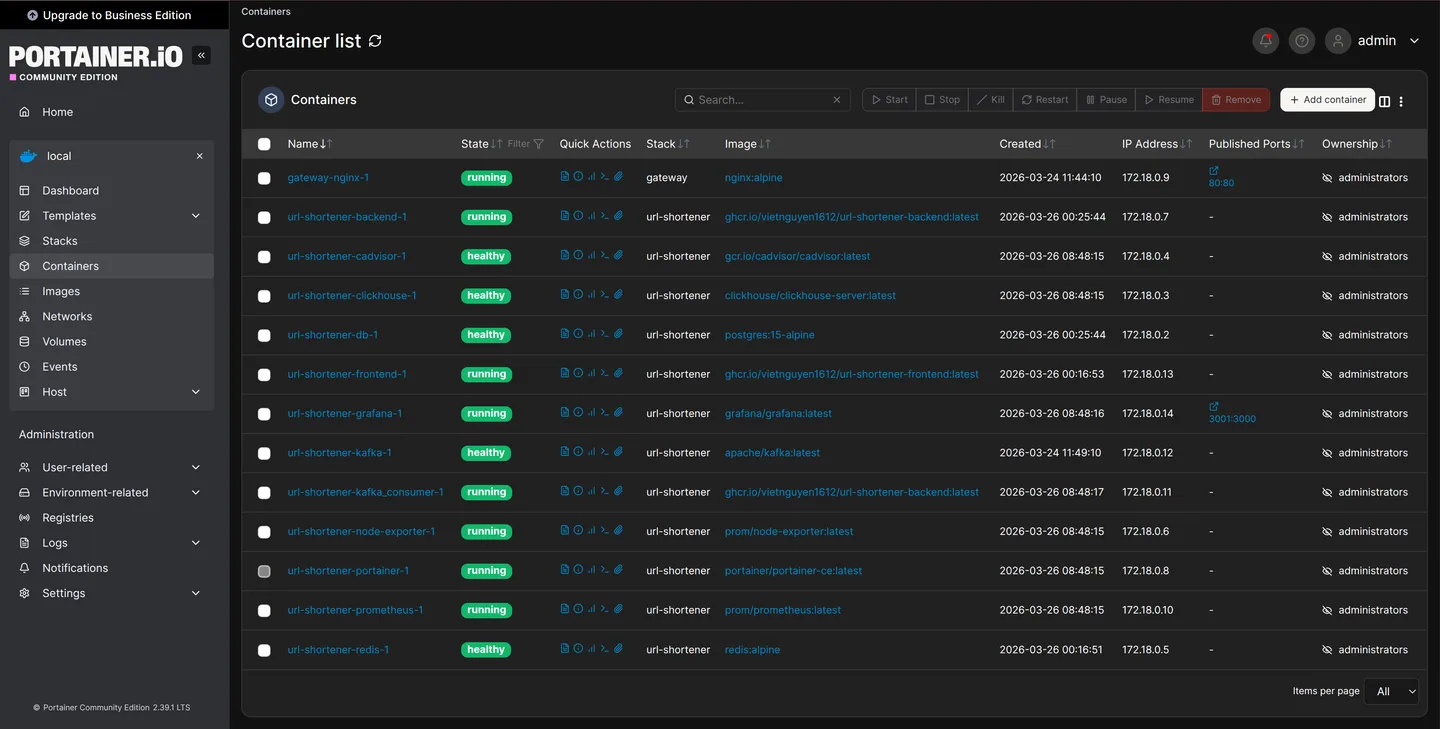
| Docker Compose | 11-service orchestration with health checks and resource limits |
| k6 | Load testing up to 1,000 VUs with Grafana dashboards |
When this architecture earns its complexity#
The project makes the trade-offs visible: a cache changes lookup cost, an event stream changes when work completes, and a separate analytical database changes where queries consume resources. Each addition introduces a new state to observe and a new failure to test. The next improvement should be chosen from measured latency or delivery behavior, rather than adding another service by default.
References and another engineering case study#
- Redis INCR semantics
The counter operation used by the identifier allocator.
- Apache Kafka delivery semantics
Why offset commits and writes to an external system need coordinated failure handling.
- Intrusion Detection System: evaluating more than one metric
A parallel example of why a single headline score leaves important behavior unexplained.