Lipid Ladder AI
Separating explicit rules, synthetic predictions and the evidence needed to trust an output
The software problem behind the prototype#
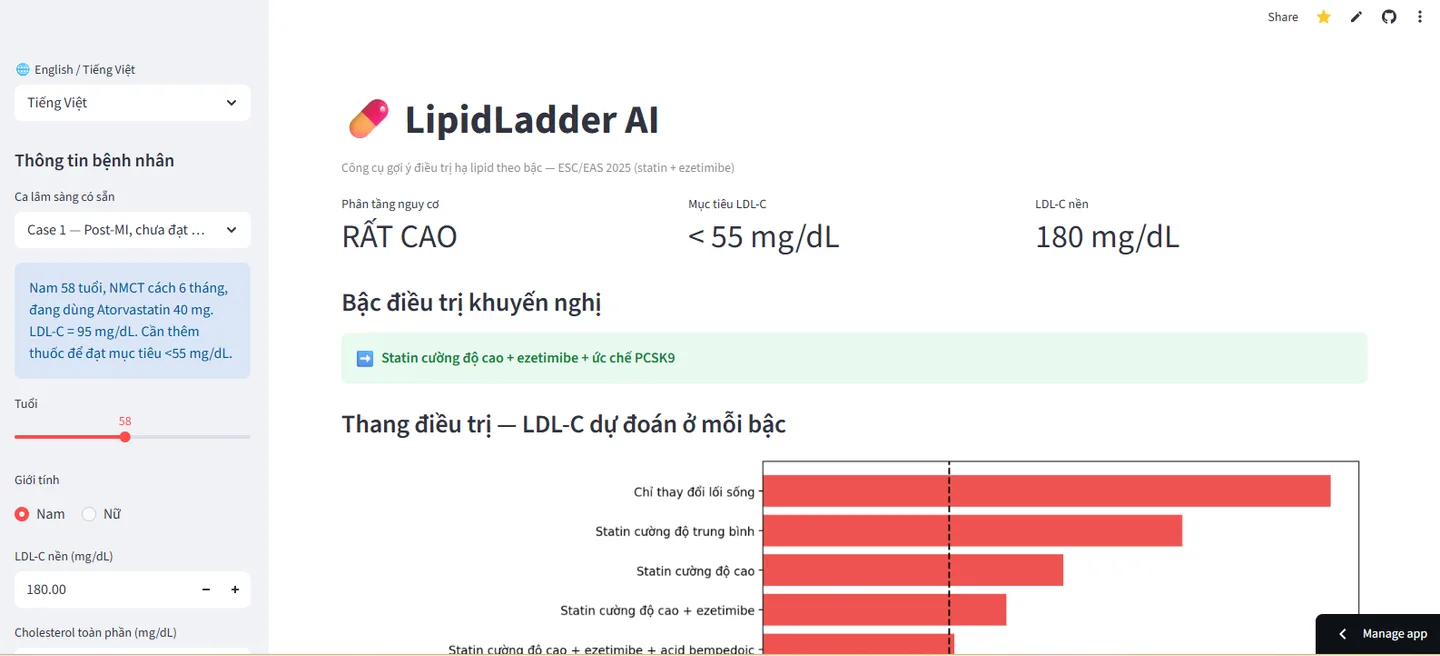
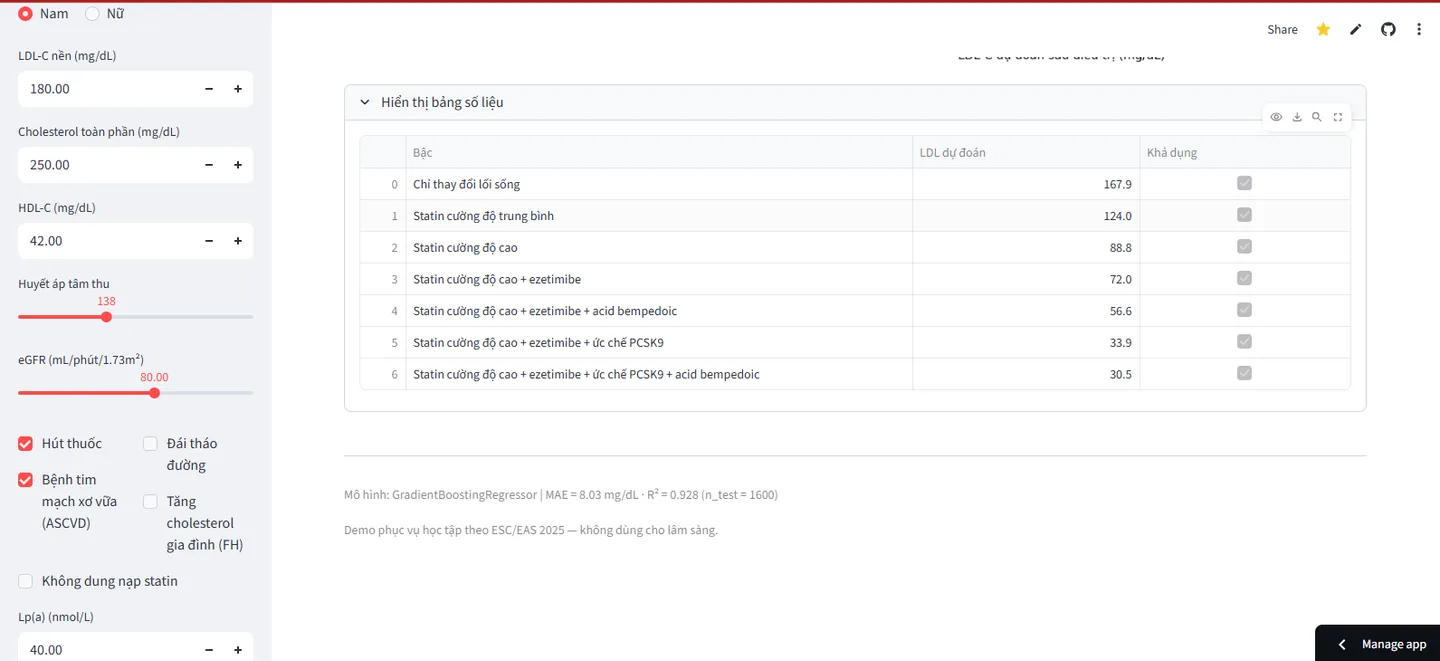
Lipid Ladder AI explores a workflow that combines explicit decision rules with an estimated numerical outcome. The application accepts a profile, computes a risk category and target, then compares model predictions across a configured sequence of options. Streamlit makes these intermediate values visible in one interface.
The project is best read as an educational software and machine-learning prototype. Its regressor is trained on synthetic cohorts. The engineering question is how to connect rules, a model and a user interface in a traceable way; the supplied evaluation does not establish that the tool improves treatment decisions for real patients.
Rules and predictions answer different questions#
A rule layer maps a set of inputs to a defined category or target. A prediction layer estimates a value from learned relationships. Combining the two without showing the distinction makes it hard to explain why an output changed: did a threshold select a new category, or did the model estimate a different response?
The original project description names the 2025 ESC/EAS focused update as its clinical reference. That reference is linked below so the intended source is explicit. Mentioning a guideline does not by itself verify that every condition, exception and update has been encoded correctly.
A traceable path from input to output#
| Layer | Responsibility | What a reviewer should be able to inspect |
|---|---|---|
| Profile inputs | Collect the scenario values. | Required fields, units, missing values and accepted ranges. |
| Rule layer | Compute the configured category and target. | Which conditions matched and which rule version was used. |
| Prediction layer | Estimate an outcome for each configured option. | Feature values, model version and the origin of training data. |
| Comparison layer | Compare estimates with the computed target. | The estimates considered, the comparison result and unresolved cases. |
| Interface | Present the scenario and its intermediate outputs. | A readable explanation rather than an unexplained final label. |
What the regressor contributes#
The project uses scikit-learn’s Gradient Boosting Regressor with tabular features. Gradient boosting combines a sequence of fitted models to improve a prediction function. Here it provides a numerical estimate that the comparison layer can evaluate against a configured target.
That estimate is a point prediction. It should not be relabeled as a calibrated confidence interval or as certainty about an individual response. The existing portfolio evidence does not establish an uncertainty model. Keeping the output terminology precise is part of making the interface understandable.
Inspecting a scenario in the dashboard#
The central limitation: learning from generated cohorts#
Synthetic examples are useful for exercising a pipeline when real-world data is unavailable. They make it possible to check feature preparation, model fitting, prediction calls and display behavior against known generated values.
They also change what a good score means. If training and test targets come from the same generation process, a strong result can show that the model learned that process. It cannot, on its own, show that the process represents real patient responses. A held-out synthetic test set helps evaluate generalization within the generator; it does not replace external evaluation.
Reading the model evaluation plot#
What to ask of the evaluation#
A predicted-versus-target plot is a useful starting point, but aggregate fit can conceal uneven errors. The next evaluation should report absolute error, inspect residuals across the input range and compare the model with a simple baseline. It should also describe how examples were split and whether repeated or closely related generated profiles could appear on both sides.
The portfolio currently provides a workflow and an evaluation visualization, rather than a reproducible external validation report. It therefore makes no claim here about clinical efficacy, reduced medication use or readiness for clinical deployment. Those outcomes would require different evidence from a regression score on generated data.
A first match is a property of an ordered list#
The documented comparison loop visits options in a configured order and stops at the first predicted value meeting the target. This makes the ordering part of the algorithm. The first matching option is not automatically an optimum over all costs, constraints or real-world outcomes.
The no-match case needs equal attention. A model failing to predict target attainment is an unresolved comparison result, not evidence that the final option in the list is appropriate. A future revision should preserve that distinction in its return value and display the unmet target explicitly instead of implying success through a fallback label.
What the implementation demonstrates#
- A Python workflow connecting profile inputs, explicit rules and numerical prediction.
- A synthetic-data regression pipeline using scikit-learn.
- A configured nine-step comparison sequence whose intermediate estimates can be inspected.
- A Streamlit dashboard for exploring example profiles and displaying the comparison.
- Localization support for presenting the same workflow in more than one language.
The next engineering iteration#
The most useful next work is to make every output reproducible: persist a scenario identifier, input units, rule version and model version together. Rule changes should be evaluated separately from model changes so that a difference in output has an identifiable cause.
Focused tests should cover values immediately around rule boundaries, absent inputs, unexpected categories and a scenario in which no estimate meets the target. These are software checks that can improve the prototype now. Establishing real-world performance remains a separate evaluation task.
Tech Stack#
| Technology | Role |
|---|---|
| Python 3.11 | Core programming language |
| Scikit-learn | ML pipelines & Gradient Boosting regression model |
| Streamlit | Interactive scenario exploration and display |
| Pandas / NumPy | Synthetic cohort generation and tabular data preparation |
| Matplotlib | Visual representations of predicted LDL-C reductions |
The lesson beyond this domain#
Whenever a product combines deterministic rules with machine learning, the interface should preserve the boundary between the two. Users need to see which value came from a rule, which came from a prediction, and what evidence supports interpreting that prediction. An inspectable workflow is a stronger engineering result than an impressive label attached to an unexplained recommendation.
Project and technical references#
- Lipid Ladder AI repository
The project source linked by this portfolio.
- 2025 ESC/EAS focused update
The clinical reference named in the original project description; this case study does not certify implementation conformance.
- scikit-learn: gradient boosting
Technical background for the regression model.
- Intrusion Detection System: adaptation and retention
A second model-evaluation case study with a different data-generation setting.